> ## Documentation Index
> Fetch the complete documentation index at: https://help.i88.io/llms.txt
> Use this file to discover all available pages before exploring further.
# i88 Ticker Pages: Price Charts, Key Metrics & Financials
> Explore price charts, key metrics, financials, sentiment, valuation, and ticker-specific news for any stock, crypto, ETF, or other asset on i88.
A ticker page is your single destination for deep analysis on any asset across all markets supported by i88 — Stocks, Crypto, Forex, ETFs, Indices, and Commodities. Every ticker page brings together price data, fundamental metrics, financials, sentiment, and more in one place. To reach a ticker page, type a symbol or company name into the search bar in the toolbar and click the matching result.
## Ticker pages by market
i88 supports six market types, and each ticker page is tailored to its asset class.
### Crypto
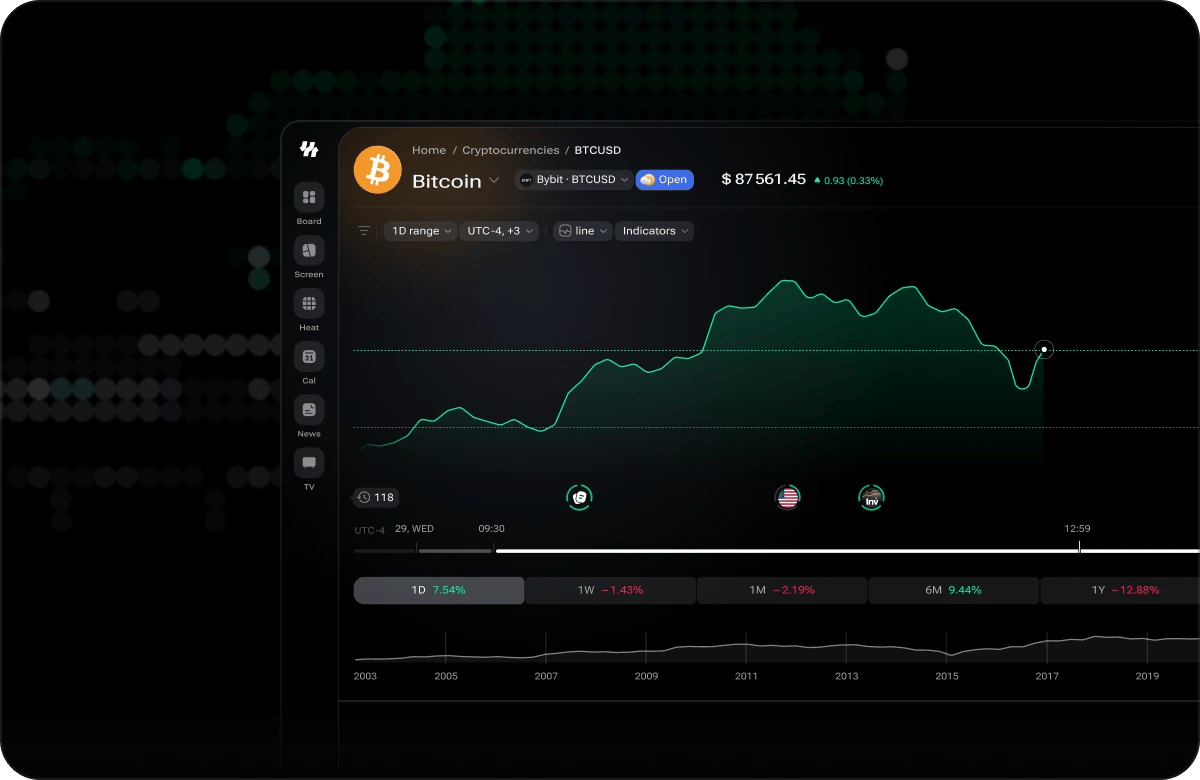 Price chart with indicators and multi-period performance (1D → ALL), an **Overview** (price performance, day and 52-week ranges, all-time high/low) and an **Insights & Activity** panel (market cap, trading volume, sentiment), plus ticker-specific news.
Crypto pages carry three further sections:
* **Technicals** — oscillators and moving averages, each with its own reading and a summary verdict.
* **Seasonals** — how the asset has historically behaved through the year, so the current move has context.
* **Holdings** — *Addresses by Holdings* breaks the circulating supply down by wallet size, and *Whale Holdings* shows the share controlled by the largest holders. Shown for coins where holder data is available.
### Stocks
Price chart with indicators and multi-period performance (1D → ALL), an **Overview** (price performance, day and 52-week ranges, all-time high/low) and an **Insights & Activity** panel (market cap, trading volume, sentiment), plus ticker-specific news.
Crypto pages carry three further sections:
* **Technicals** — oscillators and moving averages, each with its own reading and a summary verdict.
* **Seasonals** — how the asset has historically behaved through the year, so the current move has context.
* **Holdings** — *Addresses by Holdings* breaks the circulating supply down by wallet size, and *Whale Holdings* shows the share controlled by the largest holders. Shown for coins where holder data is available.
### Stocks
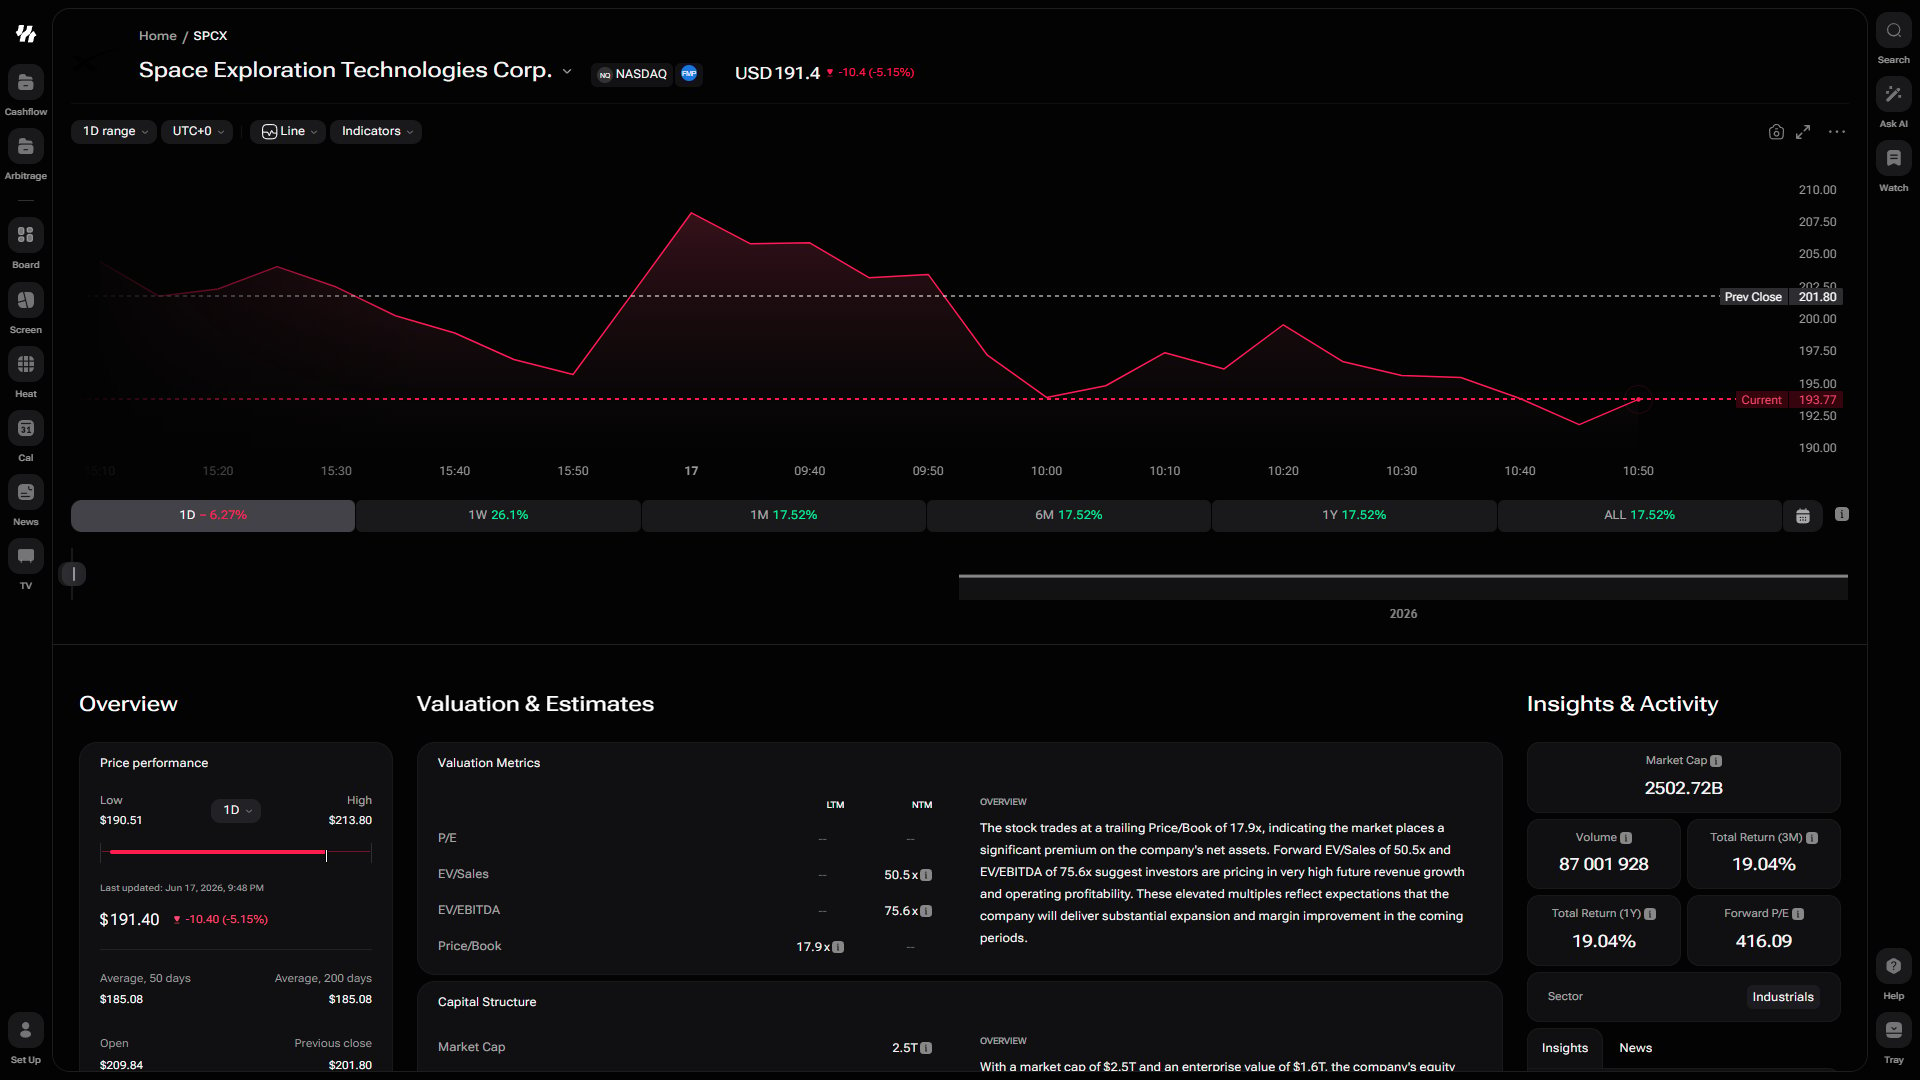 The richest layout — price chart plus **Revenue**, **Annual Margin Trends**, **Valuation & Estimates** (P/E, EPS), **Capital Structure**, **Annual Returns**, analyst sentiment, key metrics & tags, and ticker-specific news.
### ETF
The richest layout — price chart plus **Revenue**, **Annual Margin Trends**, **Valuation & Estimates** (P/E, EPS), **Capital Structure**, **Annual Returns**, analyst sentiment, key metrics & tags, and ticker-specific news.
### ETF
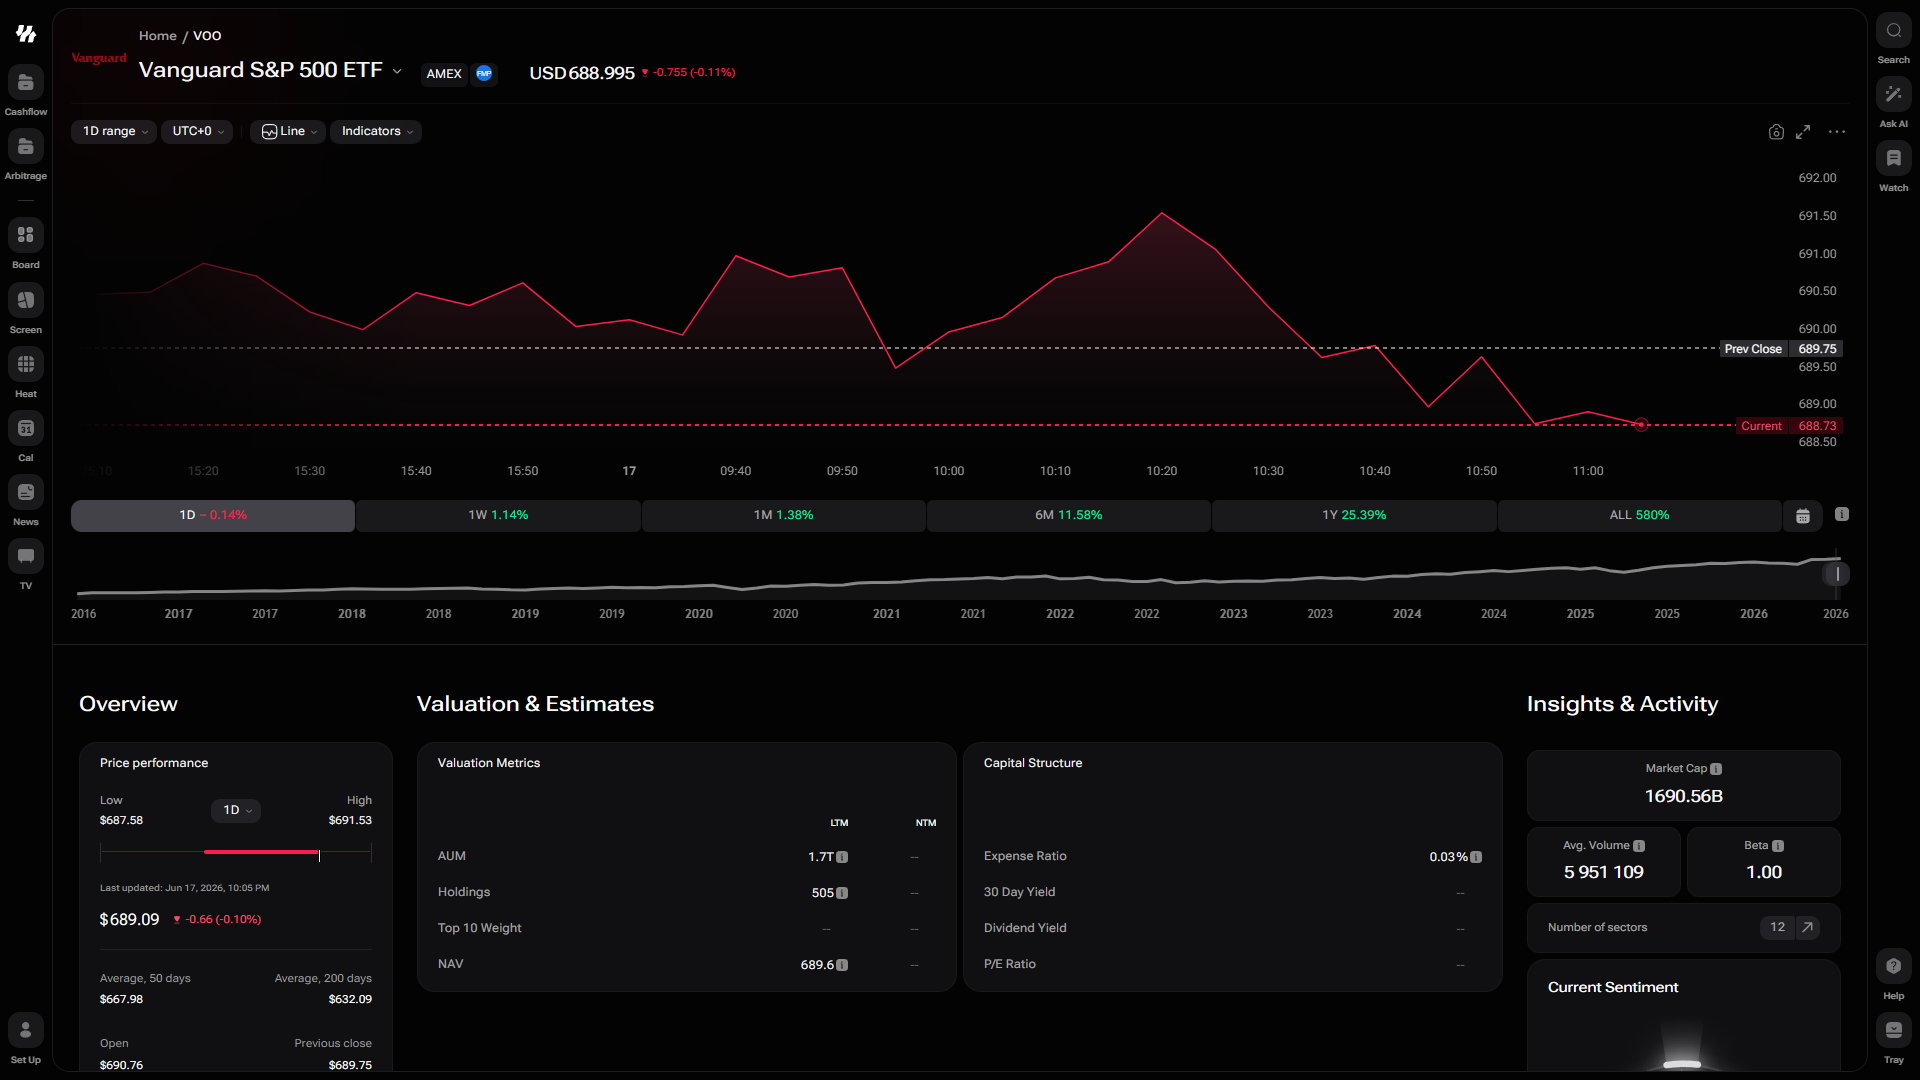 Price chart and performance plus fund-specific data — notably a **Country Allocation** table breaking down geographic exposure — alongside valuation and news.
### Forex
Price chart and performance plus fund-specific data — notably a **Country Allocation** table breaking down geographic exposure — alongside valuation and news.
### Forex
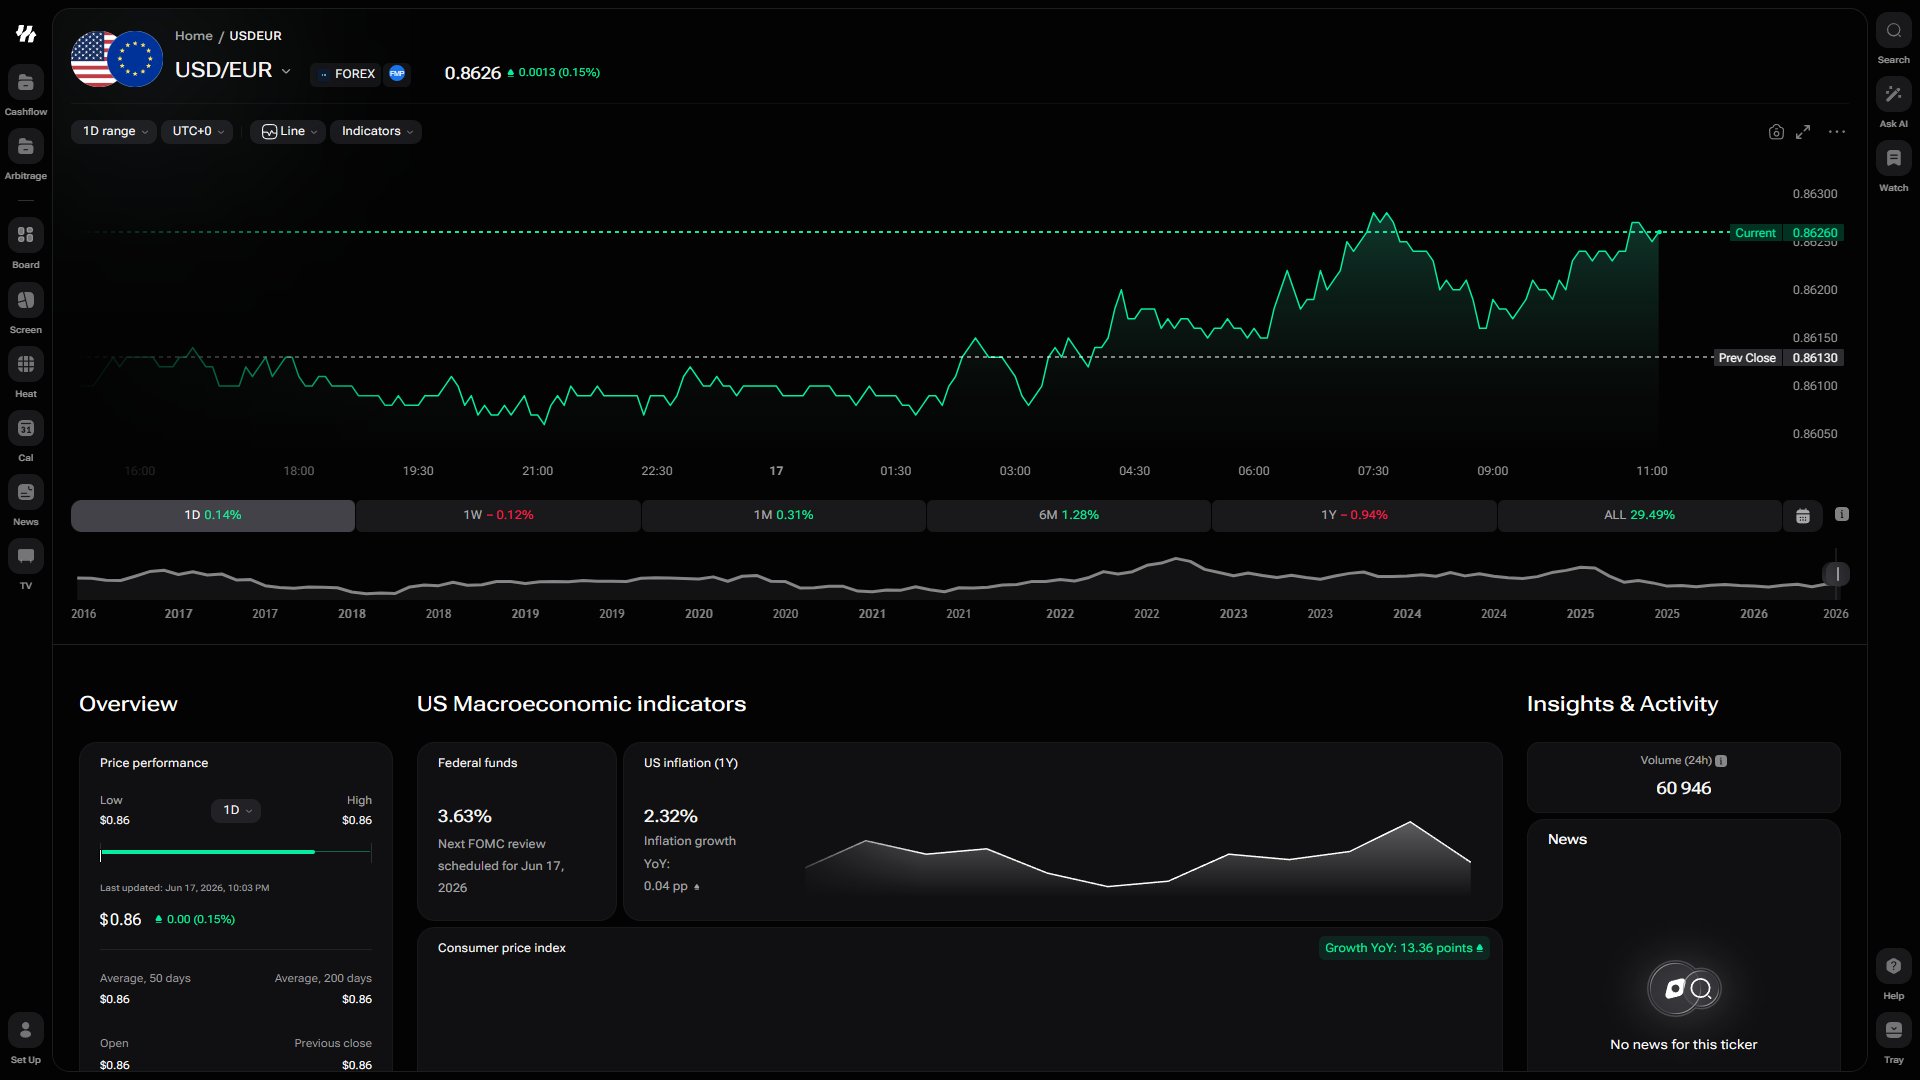 Price chart with indicators and multi-period performance for the currency pair, plus a **US Macroeconomic indicators** panel (federal funds rate, US inflation, consumer price index) and news.
### Index
Price chart with indicators and multi-period performance for the currency pair, plus a **US Macroeconomic indicators** panel (federal funds rate, US inflation, consumer price index) and news.
### Index
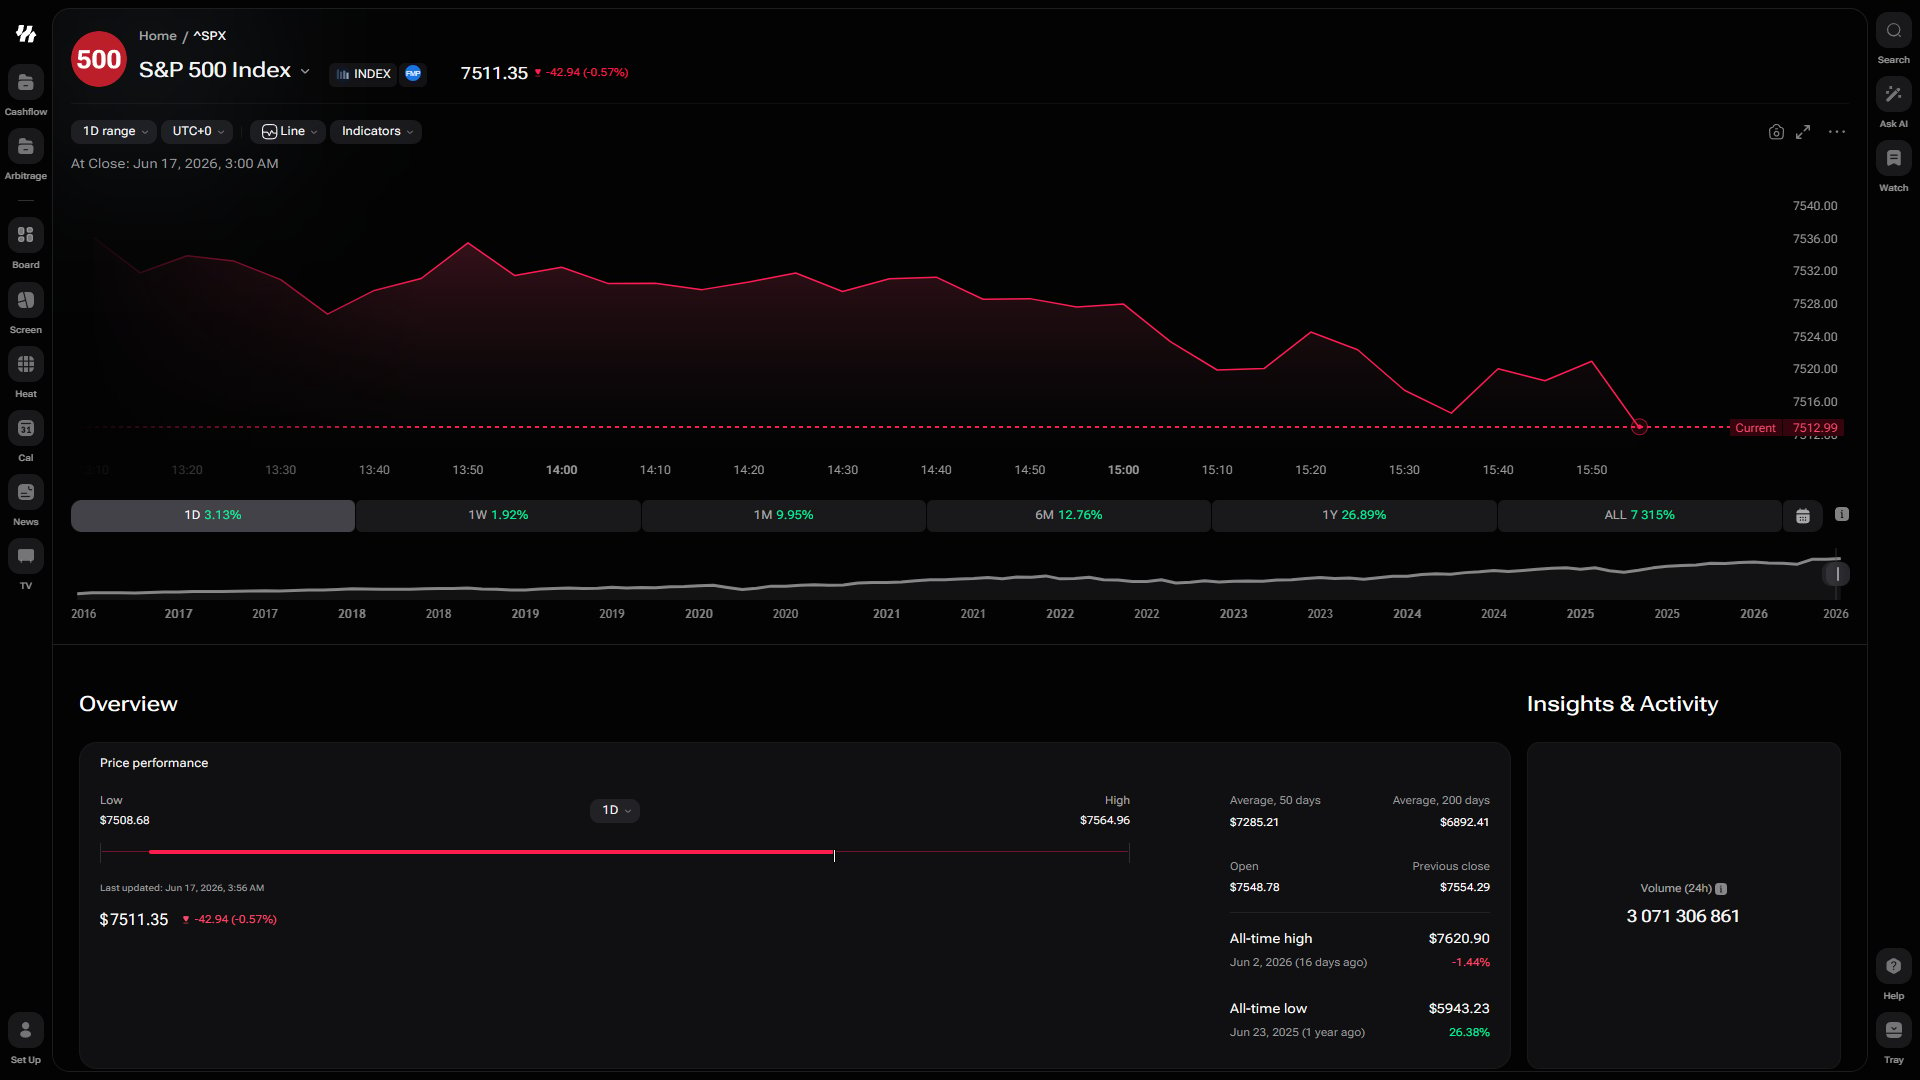 A focused layout: interactive price chart with indicators and multi-period performance for the index.
### Commodity
A focused layout: interactive price chart with indicators and multi-period performance for the index.
### Commodity
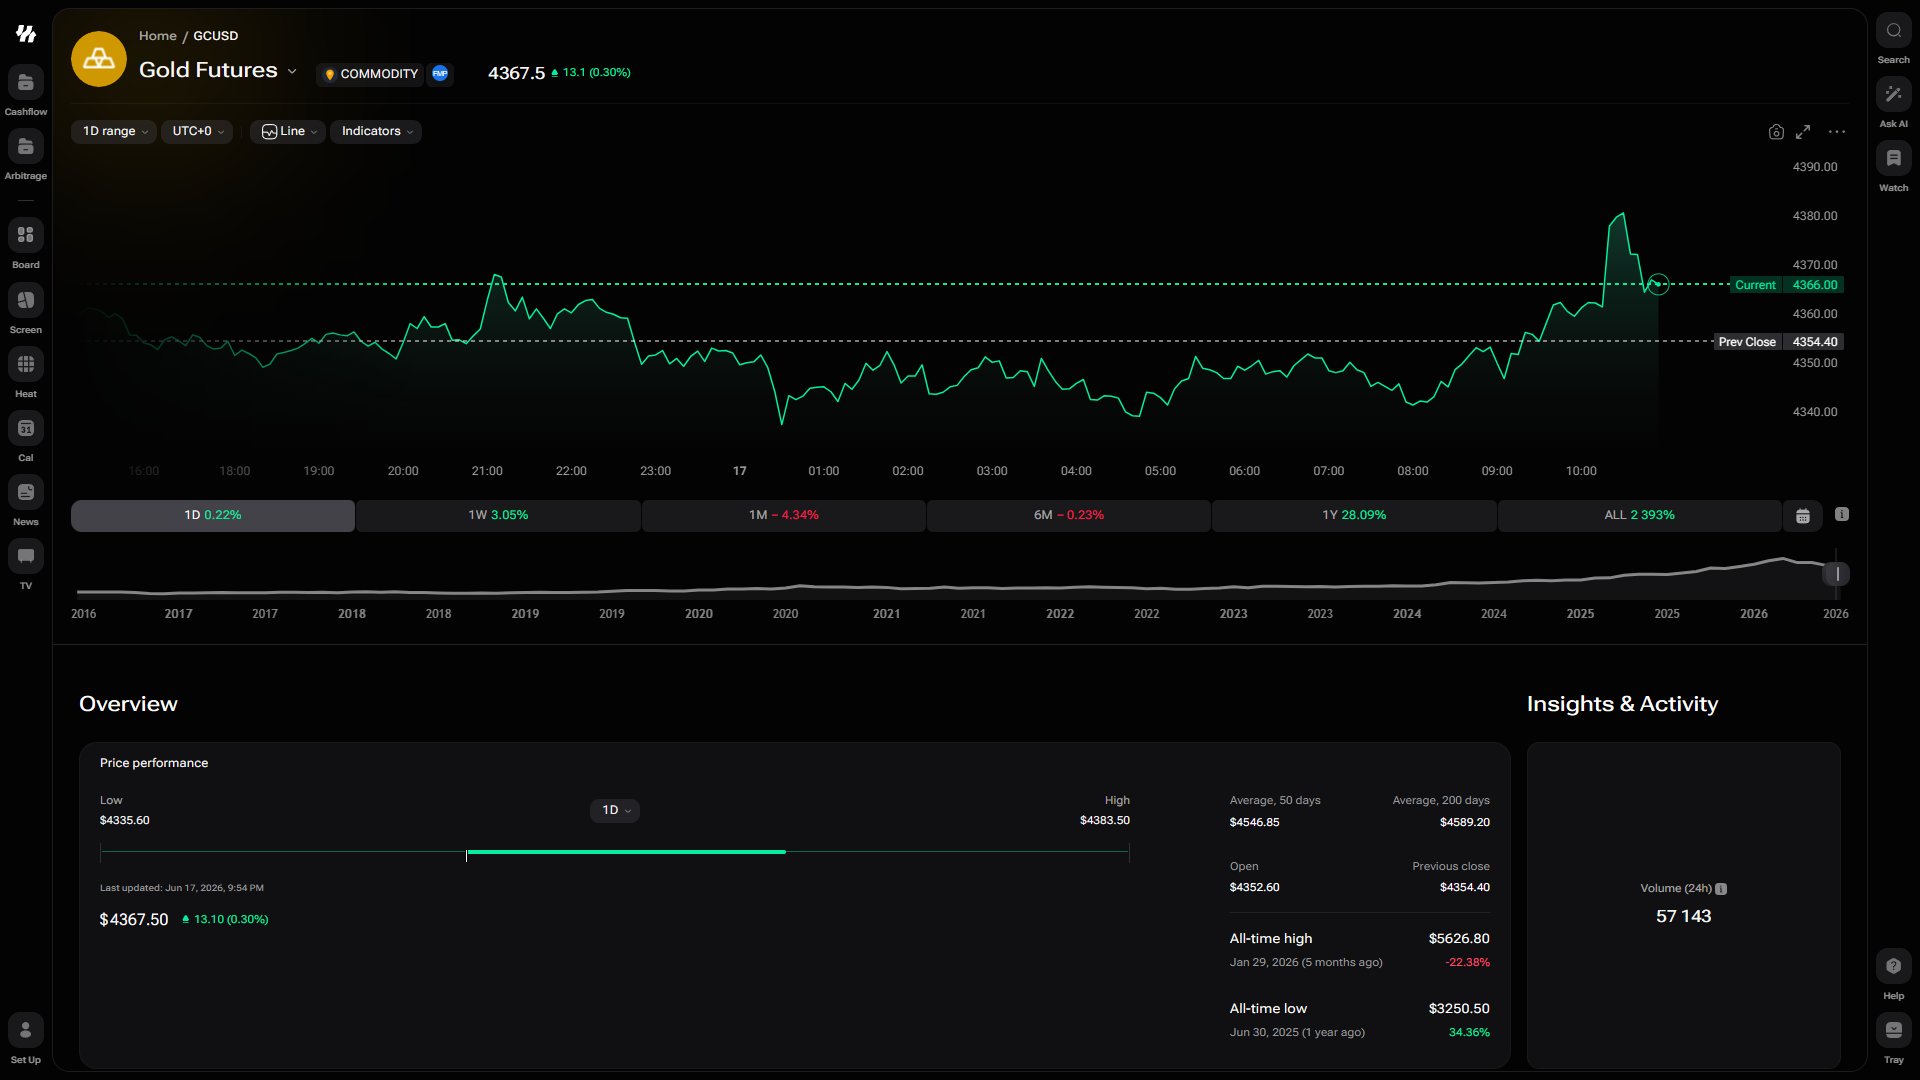 Price chart with indicators and multi-period performance (1D / 1W / 1M / 6M / 1Y / ALL), plus related news.
## Opening a Ticker Page
Use the cross-market search in the i88 toolbar to find any asset instantly.
Click the search bar in the toolbar on any i88 page.
Enter a ticker symbol (e.g. `AAPL`, `BTC`) or a full company or asset name. Results appear across all supported markets as you type.
Click the asset you want from the dropdown list. i88 opens the corresponding ticker page.
## Price Chart
At the top of every ticker page sits an interactive price chart that you can customize to match your analysis style.
* **Chart type** — Toggle between a **Candlestick** chart for OHLC detail or a **Line** chart for a clean price trend view.
* **Time intervals** — Switch between intraday, daily, weekly, monthly, and other intervals to zoom in or out on price history.
* **Technical indicators** — Add overlays and oscillators (such as moving averages, RSI, MACD, and more) directly on the chart to support your technical analysis.
## Key Sections on a Ticker Page
Scroll down from the chart to explore the full range of data available for the asset.
View historical returns at a glance across multiple time horizons — day, week, month, quarter, year, and more — so you can quickly assess how the asset has moved relative to different periods.
Review trading signals and activity metrics derived from price and volume data. Use these signals to inform your own research. See the disclaimer below regarding their intended purpose.
Examine valuation ratios including the **P/E ratio** and **EPS**, alongside analyst estimates where available. Use these figures to evaluate how the market is pricing the asset relative to its earnings.
Break down the asset's balance sheet at a high level — including debt, equity, and cash positions — to understand how the company funds its operations and obligations.
See year-by-year performance figures in the Annual Returns widget to identify long-term trends and compare performance across calendar years.
Track top-line growth with the Revenue widget and monitor profitability trends with the Annual Margin Trends section, which shows how gross, operating, and net margins have changed over time.
Check the sentiment score and breakdown to gauge the current market mood around the asset, drawing on aggregated signals from multiple data sources.
Get a snapshot of essential fundamental data points alongside descriptive tags (such as sector, industry, and market classification) that help you contextualize the asset quickly.
Read the latest ticker-specific news articles curated for the asset. These articles are filtered to be directly relevant to the company or instrument you are researching.
Access the asset's description for background context, plus links to official sources such as investor relations pages, SEC filings, official websites, and other authoritative resources for further due diligence.
## ETF-Specific Data
When you open a ticker page for an ETF, an additional **Country Allocation** table appears. This table breaks down the ETF's holdings by country or region, giving you a clear picture of its geographic exposure. Use this data to assess diversification and understand where the fund's underlying assets are concentrated.
Trading signals and activity metrics shown in the Insights & Activity section are provided for **research purposes only** and do not constitute financial advice. Always conduct your own due diligence before making any investment decision.
Price chart with indicators and multi-period performance (1D / 1W / 1M / 6M / 1Y / ALL), plus related news.
## Opening a Ticker Page
Use the cross-market search in the i88 toolbar to find any asset instantly.
Click the search bar in the toolbar on any i88 page.
Enter a ticker symbol (e.g. `AAPL`, `BTC`) or a full company or asset name. Results appear across all supported markets as you type.
Click the asset you want from the dropdown list. i88 opens the corresponding ticker page.
## Price Chart
At the top of every ticker page sits an interactive price chart that you can customize to match your analysis style.
* **Chart type** — Toggle between a **Candlestick** chart for OHLC detail or a **Line** chart for a clean price trend view.
* **Time intervals** — Switch between intraday, daily, weekly, monthly, and other intervals to zoom in or out on price history.
* **Technical indicators** — Add overlays and oscillators (such as moving averages, RSI, MACD, and more) directly on the chart to support your technical analysis.
## Key Sections on a Ticker Page
Scroll down from the chart to explore the full range of data available for the asset.
View historical returns at a glance across multiple time horizons — day, week, month, quarter, year, and more — so you can quickly assess how the asset has moved relative to different periods.
Review trading signals and activity metrics derived from price and volume data. Use these signals to inform your own research. See the disclaimer below regarding their intended purpose.
Examine valuation ratios including the **P/E ratio** and **EPS**, alongside analyst estimates where available. Use these figures to evaluate how the market is pricing the asset relative to its earnings.
Break down the asset's balance sheet at a high level — including debt, equity, and cash positions — to understand how the company funds its operations and obligations.
See year-by-year performance figures in the Annual Returns widget to identify long-term trends and compare performance across calendar years.
Track top-line growth with the Revenue widget and monitor profitability trends with the Annual Margin Trends section, which shows how gross, operating, and net margins have changed over time.
Check the sentiment score and breakdown to gauge the current market mood around the asset, drawing on aggregated signals from multiple data sources.
Get a snapshot of essential fundamental data points alongside descriptive tags (such as sector, industry, and market classification) that help you contextualize the asset quickly.
Read the latest ticker-specific news articles curated for the asset. These articles are filtered to be directly relevant to the company or instrument you are researching.
Access the asset's description for background context, plus links to official sources such as investor relations pages, SEC filings, official websites, and other authoritative resources for further due diligence.
## ETF-Specific Data
When you open a ticker page for an ETF, an additional **Country Allocation** table appears. This table breaks down the ETF's holdings by country or region, giving you a clear picture of its geographic exposure. Use this data to assess diversification and understand where the fund's underlying assets are concentrated.
Trading signals and activity metrics shown in the Insights & Activity section are provided for **research purposes only** and do not constitute financial advice. Always conduct your own due diligence before making any investment decision.