

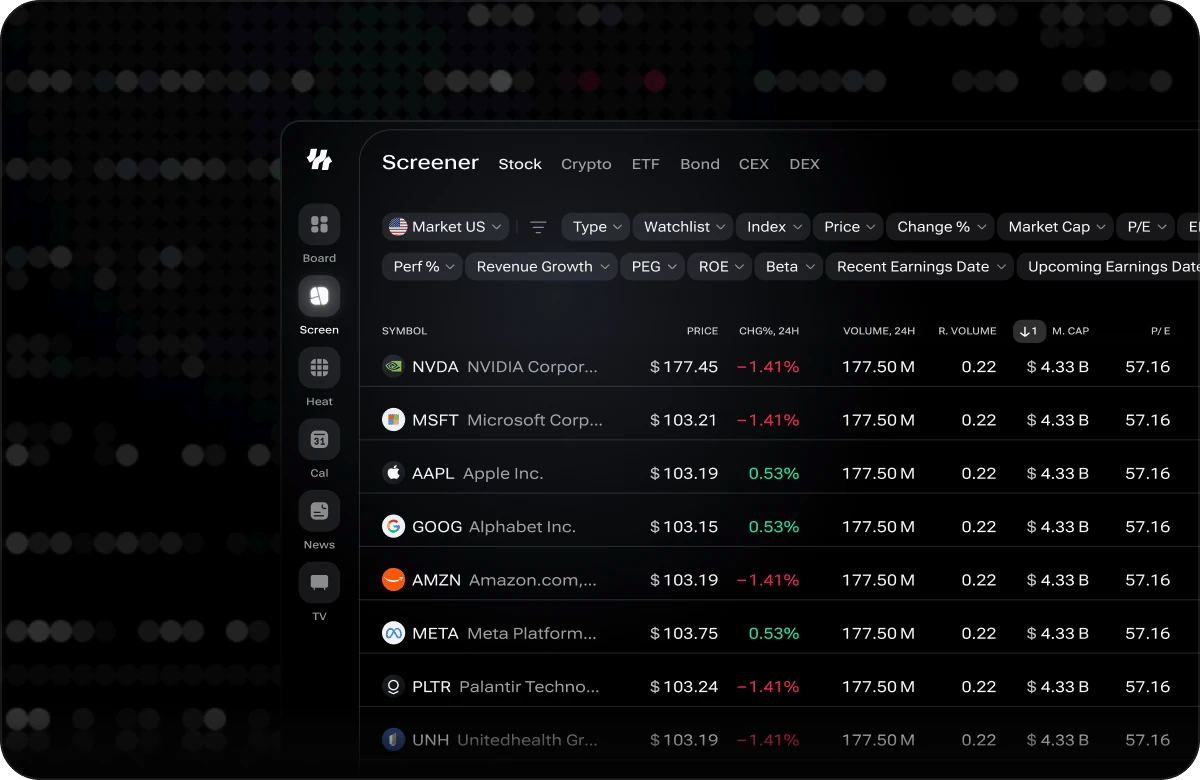
The Stock screen: market tabs beside the title, filter chips below it, results in a sortable table
Screens
Tabs sit next to the page title and swap the whole screen — its filters, its columns, and the market it queries.Filtering
Each filter is a chip below the page title. Click one to open it, choose a condition, and the chip shows what you picked —Market Cap: 10B to 200B, for example. The table refreshes once, when you confirm.
Ranges come as ready-made conditions. Rather than asking you to invent thresholds, numeric filters offer named bands with a short explanation — Giants among giants for the largest capitalisations, Hidden gems for the smaller end of the range, and so on down each scale. Pick the band that matches your thesis.
Lists come with search. Sectors, industries, exchanges, countries and networks are long lists, so each opens with a search field and Select all / Clear controls. Country entries carry their flag.
One filter is pinned first. Every screen leads with the filter that frames it — Country on Stock and ETF, Exchange on CEX, Network on DEX. Crypto has no pinned filter.
Clearing up. Once anything is applied, a Clear all filters control appears at the end of the chip row and resets the screen to its default state.
What you can filter by
Stock
Stock
Price · Change % · Market Cap · Volume · Relative volume · P/E · EPS diluted growth · Dividend yield % · Revenue growth · PEG · ROE · Beta · Sectors · Industries · Analyst ratings · Exchange · Country
Crypto
Crypto
Price · Change % · Market Cap · Volume
ETF
ETF
Country · Price · Change % · Market Cap · Volume · Relative volume · Dividend yield % · Beta · Sectors · Exchange
CEX
CEX
Exchange · Contract type (perpetual or futures) · Price · Change % · Volume
DEX
DEX
Network · Price · Change % · Market Cap · Volume · Liquidity · Fully diluted valuation
The Table
Results arrive as a table with Symbol in the first column and the metrics of that screen alongside it.- Sorting — click a column header to sort by it. Sorting runs across the whole result set, not just the page you are looking at, so the top of the list is the true top of the list.
- Columns — each screen ships with a sensible default set and keeps the rest one click away in the column settings. Show what you follow, hide what you do not, and drag headers into the order you read them in. Drag the edge of a column header to make it wider or narrower. Your choice of columns, their order and their widths is remembered per screen.
- Opening a result — click through from any row to that instrument’s ticker page for the full picture.
Paging Through Results
The bar under the table shows the total number of matches on the left, page controls in the middle, and Rows per page on the right — 25, 50 or 100. Changing a filter, the sort order or the page size returns you to the first page.Sharing a Screen
The screener keeps its state in the address bar, so the view you have built is something you can send, bookmark or come back to.- Filters and sorting live in the URL. Every chip you apply and the column you sort by are written into the address as you work.
- Share copies the link. The Share control in the toolbar puts the current address on your clipboard and confirms that it copied.
- A shared link restores the screen. Whoever opens it lands on the same market tab, with the same conditions applied and the results ranked the same way.
A link carries filters and sorting. Which columns you show, and in what order, stays a personal preference remembered per screen on your own device.
When Nothing Comes Back
- No instruments match your filters — the conditions are too narrow. Use Reset filters on the empty state to start again.
- Narrow the list first — some sorts and filters are too heavy to run across the entire market. When you see this message, add a sector, market cap, price or volume filter, and the same query will run.
- Something went wrong — a connection or service issue. Try again re-runs the request; if results are already on screen, a thin banner appears above them rather than clearing what you have.